
What We’re Watching: Market Review & Outlook – March 2022
April 2022
Non-Financial Credit:
Summary views: public investment grade markets remain expensive but are wider over the quarter, with the US cheapening faster than Europe or Australia. Private markets still look better relative value with illiquidity premiums near the wides though a like for like comparison on credit risk remains important.
Having experienced an almost uninterrupted rally since the onset of the COVID-19 pandemic in March 2020, even Australian credit markets started to sag in the first quarter. Initially the move wider was driven by higher interest rates and the inflation outlook but the second (and sharper) move occurred in the immediate aftermath of the Russian forces invasion of Ukraine.
In relative terms, Australian credit was 28% wider over the quarter, the worst performing of all the markets tracked in the chart below. Notably though more liquid markets such as US investment grade credit were closer to 40% wider at the lows of the market in the middle of March. Note that as at quarter end, spreads had more or less retraced the second move wider and across most markets were sitting at pre-invasion levels.
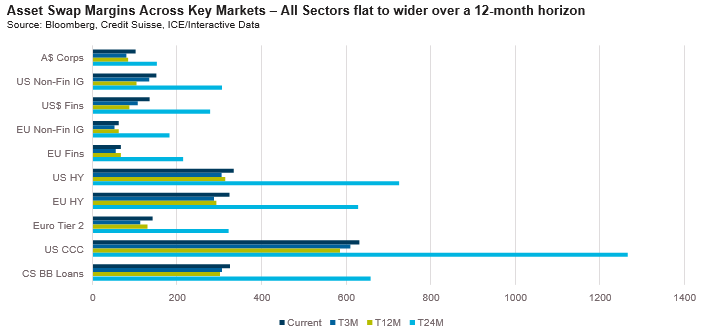
The combination of higher spreads and higher yields has led to outright returns looking increasingly attractive but equally has resulted in significant capital losses for investors. The yield of the BAML/ICE Australian Credit Index is now almost 4%, almost 2% higher over the quarter. The Q1 loss for investors was 5.3%, the worst performance since the index started in 1997. The next worst loss was 1.6% in Q4 of 2021. In offshore markets the performance of credit was even worse; the longer duration led to close to double digit losses. Investors have never experienced losses like this in their fixed income allocations.
The rationale response from an investor to this is to say that credit looks cheaper so let me have some of that. But we all know that many investors are not rational. They see the losses and in the eye of the storm worry that more losses are coming. Already this is playing out in the United States, with retail fund flows consistently negative since late 2021 and getting worse. Domestically our markets are less exposed to retail flows given the lack of retail participation. Of greater note in Australia has been the move in the Yen which has weakened against Australian dollars, resulting in Japanese investors selling Australian dollar fixed income product.1
The flipside of the demand equation is supply. In an environment of rising interest costs, we’d expect to see issuance slow. However, in the United States this has not been the case with cumulative investment grade issuance in line with 2021, albeit slightly below the record levels of 2020. Domestically corporate non-financial issuance at A$8 billion was more moderate, slightly below the post-GFC average of A$9.6 billion.
Despite the weaker technical outlook, corporate fundamentals look robust. Even with the prospect of a rising interest burden for borrowers, rising stars (high yield corporates upgraded to investment grade) continue to outpace fallen angels (investment grade borrowers downgraded to high yield).
On the private side, M&A activity continued its momentum into the Mar-22 quarter with both financial sponsors and corporates contributing to healthy deal volumes. Notable large deals included:
- Blackstone’s $6.2bn bid for Crown Resorts;
- Vocus NZ’s $1.7bn acquisition of 2degrees, to form NZ’s 3rd largest mobile operator;
- Brookfield’s $1.1bn offer to buy LaTrobe Financial Services from Blackstone;
- EQT’s $710m bid for Stockland’s Retirement Living portfolio; and
- Quadrant PE’s sale of Experiences Australia Group to US strategic bidder Hornblower Cruises & Events for ~$450m
Financial Credit:
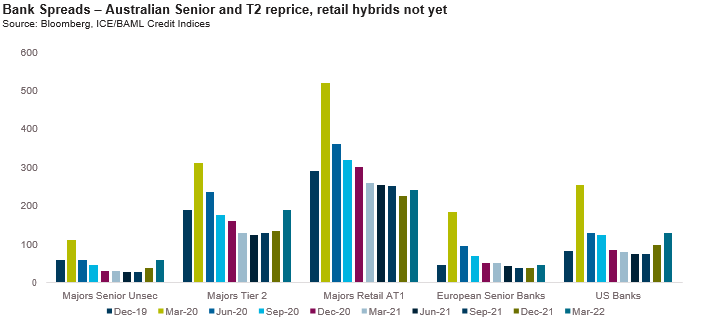
Summary views: domestic financials (ex AT1 securities) repricing has normalised to pre-COVID levels and looks neutral to offshore markets. Retail hybrids look very expensive relative to Tier 2
Regular readers will know that our quarterly pieces can often sound repetitive with the same themes repeated quarter after quarter. This is why our positioning across our suite of funds doesn’t change frequently or in large ways. We are the large cruise ship not the speedboat.
But every so often there is a quarter where our views and positioning will move meaningfully on the back of a shift in valuations or a change in technical or fundamental conditions. This quarter is one of those. After being negative on domestic financials for well over 12 months we have started to see value come back into the sector. Spreads across the financials complex have returned to pre-COVID levels with the notable exception of the retail bank hybrid market in Australia which remains tight in both absolute and relative terms (more on that later). It’s also notable that US markets, the most liquid market and arguably a leading indicator of actual conditions, are considerably wider than December 2019 levels. This is one of the reasons why we think the move in bank spreads could have more to run.
Domestically, major bank senior issuance was a record, exceeding $40 billion for a quarter for the first time on record. This compares to a pre-COVID average of around $24 billion per quarter. This has driven the clearing level for a benchmark major bank deal to the mid 80s in spread terms. Tier 2 issuance from the majors was also elevated at $3.5 billion but arguably not to the same degree as for senior.
Looking forward, the issuance task for the majors on Tier 2 appears on track. For financial year 2022, they guided towards $18 billion of issuance, and have completed more than 50% (remember 3 of the 4 banks have financial year ends in September). Absent capital volatility, the Tier 2 issuance task appears reasonably manageable with the major banks holding total Tier 2 capital of $75 billion, slightly over 4% of risk weighted assets but on track to meet the requirement of 4.5% of risk weighted assets by January 2024.
We contrast the relatively predictable Tier 2 issuance with the highly uncertain outlook for senior. We and many others have discussed at length the ending of the c. $102 billion Committed Liquidity Facility and impending wind down of the $188 billion Term Funding Facility but remain one of the few participants who are concerned about the potential for deposit outflows to drive increased issuance. Remember that deposit inflows from retail and commercial borrowers have totalled close to $300 billion during COVID. Higher interest rates and higher spending will ultimately start to weigh on these flows.
Offshore financials issuance seems to be playing out consistently with significant levels of senior issuance. European bail- inable senior issuance has hit €65 billion, running 23% of the previous two years while Tier 2 issuance has been broadly flat at €11 billion.
Lastly, domestic additional Tier 1. Rather than try to re-word our last quarter’s commentary we decided to reprint it verbatim. The same themes remain intact, and with institutional markets widening, the expensiveness of the retail hybrid market is even more stark. The surprising part of this was that ANZ and CBA actually issued primary deals at margins of 270 and 275 basis points respectively (both of which rallied strongly off the break!). So here are last quarter’s comments:
“At the other end of the spectrum stand retail additional Tier 1 notes which stand out as being very expensive being the one part of the credit stack that actually rallied into year end. Interestingly the greatest widening was in senior, with Tier 2 moderately wider and Tier 1s tighter. This reflects a largely technical rather than fundamental situation and it is possible that it persists for some time. There are $3 billion in AT1s due to be called in the first quarter and if reissue spreads remain at current levels, call risk in these deals could prove a material risk”
ABS & Whole Loans:
Summary views: favouring offshore securitised versus domestic, high investment grade has repriced but junior classes have more to go, private markets ABS less attractive than corporate or real estate lending.
Within securitised markets the following themes are most relevant:
- Issuance continues at a pace and is less sensitive to market conditions than corporates;
- Demand is questionable in domestic markets with the end of stimulus programs impacting senior demand; and
- Spreads are widening in line with broader markets with call incentives shifting for issuers. We’ll explore each in turn in this month’s piece. Firstly, issuance.
Domestically Q1 issuance was over $10 billion making it the busiest quarter in the post-GFC era. The backdrop to this issuance was warehouse exposures ending 2021 at over $70 billion across the 4 majors alone. NAB’s warehouse exposure exceeded Westpac’s for the first time on record making it the largest warehouse bank in the country. As we have previously noted, the size of the warehouse market is a leading indicator of future issuance.
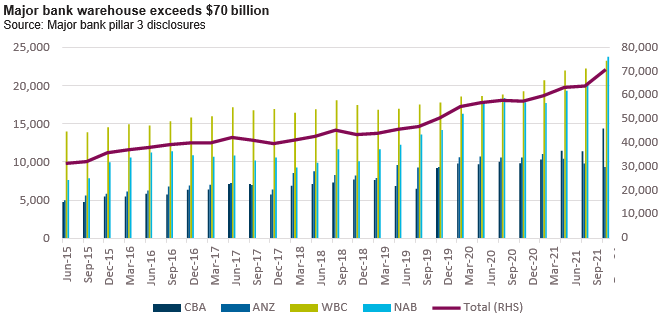
The more timely RBA financial aggregates data also points to more issuance with lending volumes by banks and non- banks alike hitting all time peaks at February month end. Non-Bank Financial Institution (NBFI) loans and advances now exceed $250 billion with banks exceeding 3 trillion (yes, $3 trillion).
In offshore markets, issuance has been similarly elevated. US Credit Risk Transfer (CRT) issuance was over US$9 billion in the quarter, up US$3.5 billion compared to the same period last year. The sizeable issuance combined with potential impacts of higher interest rates resulted in spreads on investment grade tranches widening by 125 basis points, well into the 200s. Equally European ABS issuance was a post-GFC peak with JP Morgan highlighting YTD issuance of EUR22.9 billion, albeit with pricing not widening nearly as much as the US CRT markets (BBB-rated tranches were less than 100 basis points wider over the quarter).
Secondly, demand.
We’ve repeatedly highlighted the technical bid for repo-eligible securitised products coming from the major banks. With the Committed Liquidity Facility winding down in 2022 and the impending repayments from the Term Funding Facility, banks have less of a need to acquire repo-eligible bonds.
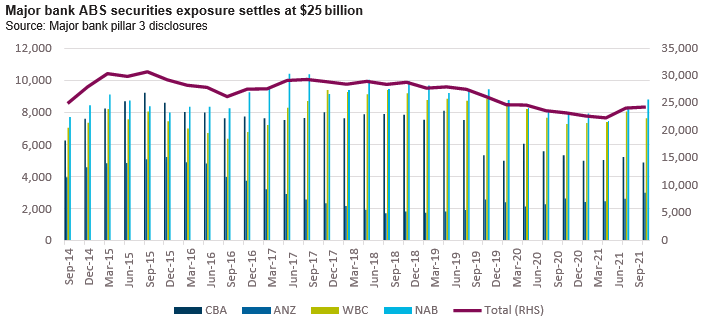
Interestingly though we have seen holdings pick up with the bulk of the increase occurring in the September quarter with the increase concentrated in the most active warehousing banks. This suggests that the demand is being driven by supply of deals, not necessarily outright demand from banks. Indeed, public securities is 26% of major bank third party securitised holdings, a post-GFC low and down from 50% as recently as March, 2015. Bank demand is certainly not growing with supply.
Away from banks, we are still seeing strong mezzanine demand, especially from retail investors but one wonders how much longer this can persist for. Wider credit spreads and steeper interest rate curves has made fixed rate corporate paper a far yieldier proposition than floating rate securitised paper for real money investors.
Next, Spreads and their impact on call incentives.
Over the quarter, spreads across the securitised capital stack moved wider. A-rated non-conforming RMBS spreads were wider by 85 basis points over the quarter. Across the capital stack the weighted average cost of funds of an Australian non-conforming RMBS increased by over 40 basis points over the quarter. This move exceeds the impact of the step up in coupon margins if the deal is not called which blends to around 20 basis points. While the increase in cost of debt exceeds the step up margins in deals, we don’t think we are at the point where issuers will be contemplating not calling transactions. Other structural features such as sequential payment structures (i.e. paying the cheapest notes first), reputational considerations and other features such as excess spread diversion will continue to protect buyers. This being said if spreads continue to widen and we start to see arrears increase and prepayment speeds slow, the call equation could change quickly. Investors, particularly those in junior tranches should be mindful of this risk.
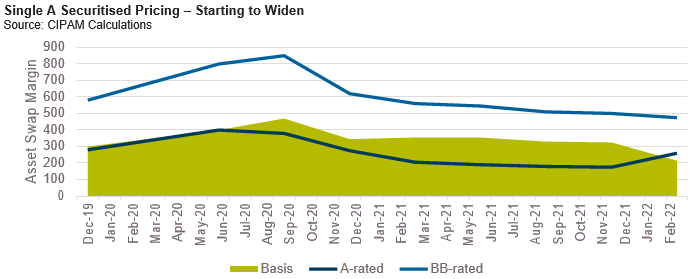
While the 85 basis point increase in single A pricing mentioned above exceeded the roughly 60 basis point increase in major bank Tier 2 pricing, BB-rated and BBB-rated spreads actually tightened over the same period with BBB spreads. In fact, as the above chart shows, the basis between single A and BB-rated tranches is the lowest it has been for the last couple of years and by our estimation, the lowest it has been since the Global Financial Crisis. This seems difficult to reconcile as with senior pricing widening, the risk of extension in RMBS transactions is growing. Offshore pricing seems more rational with single A-rated CLO tranches reversing all of the tightening experienced in 2021 in Q1 of 2022. We think the BB-tranche is the most expensive part of the ABS capital structure right now.
Real Estate Loans:
Summary views: strong lending growth from foreign branch banks continue but impact of China property slowdown could still be felt, Strong issuance in public markets could see attractive relative value emerge.
APRA data through the December 2021 quarter showed commercial property exposure limits for ADI’s continued to increase ending at $392.6 billion ($328.2 billion drawn), a 9% annual growth rate. The major banks market share of Australian exposures which moved below 72% for the first time since 2008 in the September quarter has continued to decline through the December quarter with major bank share of tourism and leisure lending the lowest at around 40%.
The greatest increase in exposures came from the industrial sector which grew at over 20% for the year. Interestingly Tourism and Leisure lending moved backwards over the quarter and was flat year on year despite strong growth over a 3 year horizon.
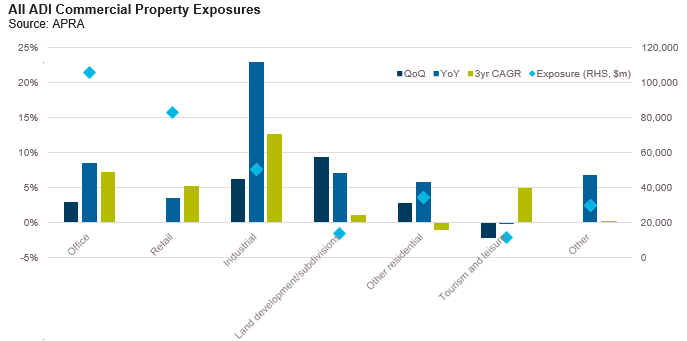
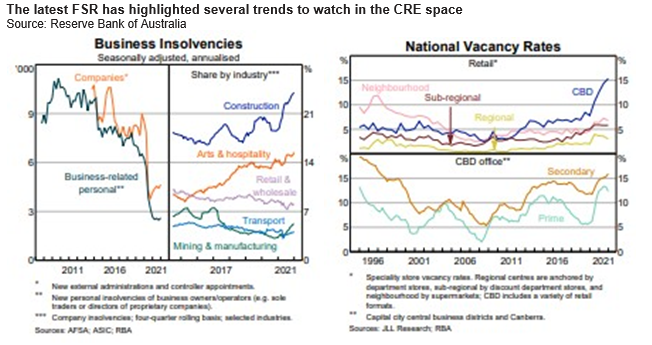
Impairments remain non-existent at 0.10% of total exposures. Last quarter we called this out when impairments dropped below 0.15%, itself the lowest on record (dating back to March 2004) asking the question, “can it get any better?” Clearly it could. Despite all appearing calm on the commercial real estate lending front we did note some commentary in the latest Financial Stability review which highlighted a number of trends that are worth watching closely.
Firstly, stress in the construction sector. The FSR showed a sharp uptick in the share of construction borrowers entering into insolvency over the past year. We have already discussed the stress the construction industry is facing with cost inflation pressures and delays to projects making fixed price contracts untenable. To date, asset price inflation has meant that lenders have not shared the pain but if asset prices slow it seems inevitable that some lenders will be impacted.
Secondly, in contrast to the residential market vacancy rates continue to rise in both retail and office. CBD retail is particularly hard hit with vacancy rates more than doubling to over 15%. CBD office is also experiencing vacancies of close to 15%. Compression in cap rates has shielded lenders from these trends thus far but with interest rates increasing further cap rate declines seem unlikely.
Lastly, it would be remiss of us not to mention the FSR’s commentary on the financial strength of the A-REIT sector which has maintained a decent amount of discipline, maintaining leverage at around 30% despite very strong liquidity and interest coverage. We’d note however that the flat leverage does reflect increased asset valuations and will come under pressure should valuations decline.
1 A discussion for another day is how currency moves affect offshore demand for Australian credit. Suffice to say that when the Yen decreases in value, Japanese domiciled investors, who are the largest foreign holders of Australian fixed income, become sellers.
Unless otherwise specified, any information contained in this material is current as at date of publication and is provided by Challenger Investment Partners Limited (CIP Asset Management, CIPAM) (ABN 29 092 382 842, AFSL 234678), the investment manager of the CIPAM Credit Income Fund and CIPAM Multi-Sector Private Lending Fund (the Funds). Fidante Partners Limited ABN 94 002 835 592, AFSL 234668 (Fidante) is the responsible entity and issuer of interests in the Funds. Fidante and CIPAM are members of the Challenger Limited group of companies (Challenger Group). Information is intended to be general only and not financial product advice and has been prepared without taking into account your objectives, financial situation or needs. You should consider whether the information is suitable to your circumstances. The Fund’s Target Market Determination and Product Disclosure Statement (PDS) available at www.fidante.com.au should be considered before making a decision about whether to buy or hold units in the Fund. Past performance is not a reliable indicator of future performance.
Fidante and CIPAM are not authorised deposit-taking institutions (ADI) for the purpose of the Banking Act 1959 (Cth), and their obligations do not represent deposits or liabilities of an ADI in the Challenger Group (Challenger ADI) and no Challenger ADI provides a guarantee or otherwise provides assurance in respect of the obligations of Fidante and CIPAM. Investments in the Fund are subject to investment risk, including possible delays in repayment and loss of income or principal invested. Accordingly, the performance, the repayment of capital or any particular rate of return on your investments are not guaranteed by any member of the Challenger Group.
Any projections are based on assumptions which we believe are reasonable, but are subject to change and should not be relied upon.