
What We’re Watching: Market Review & Outlook – June 2022
July 2022
Non-Financial Credit:
Summary views: public investment grade markets have repriced with pockets of value emerging. European markets look cheapest reflecting the poor macroeconomic conditions, followed by United States then Australia which remains expensive. Private markets are starting to reflect the weaker public market conditions with illiquidity premiums normalising
In quarter one of 2022, major movements in markets were driven by yields. In the June quarter, credit spreads were wider across all the main markets we track. In the case of Australia spreads are now sitting at around the average of the 2010-2019 decade and around 50% wider than the post-GFC tights for the market. Offshore spreads are wider with European spreads now over 40% wider than the average and 250% wider than the tights.
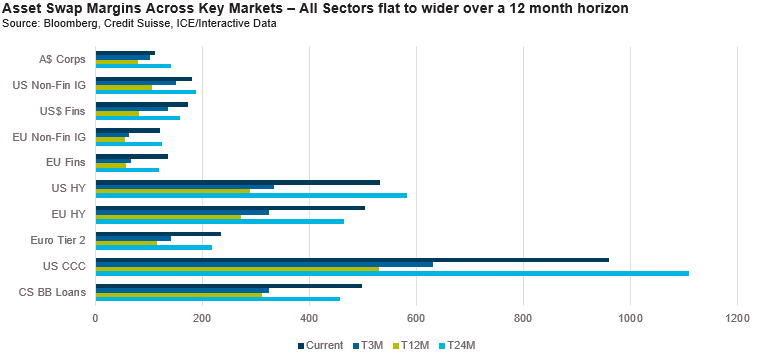
As shown above, high yield and leveraged loan markets struggled. European high yield bonds are now wider than levels 24 months prior. Having held in remarkably well, leveraged loans widened sharply over the quarter as well, ending the quarter at 24 month wides.
The move in spreads comes at a point of inflexion for markets. On a backwards looking basis, fundamentals appear sound. In high yield markets, Citi noted that on a trailing 12 month basis over 1,000 bonds have been upgraded and only around 300 have been downgraded, a record figure albeit one which does not yet offset the trailing 12 month figure of 1,500 downgrades during 2020. Across all sectors leverage, interest coverage and profitability metrics are better than historical averages with industrials looking weakest in terms of leverage and interest coverage.
However what really matters for markets is the forward outlook and judging by sentiment indicators, these are worse than historical averages. In the United States the University of Michigan consumer sentiment index plunged to the lowest level since the 1980s. In Australia the NAB business survey for June declined driven more by expectations than conditions. Lastly in Europe, which is really the epicentre of the global inflation pressures1, the ZEW survey for growth expectations hit the lowest level since the 2011 Euro crisis.
Reflecting the weak sentiment and wider spread/higher yield environment, primary markets were quiet. In Australia, borrowers turned to the banks with RBA data showing strong growth in commitments to large businesses. This is hardly a surprise when banks are charging average interest rates of 2% to large corporate borrowers compared to a 4.5% yield to maturity on the Bloomberg AusBond Credit 0+ index. Corporate bond issuance was muted with only $7.5 billion in issuance for the quarter, $5 billion less than the corresponding quarter in 2021. In the United States, issuance is also down with cumulative non-financial investment grade issuance down 24% from 2021.
In private lending markets M&A activity continued its momentum into 2022 with both financial sponsors and corporates contributing to healthy deal volumes. Notable large deals included
- Blackstone’s $6.2bn bid for Crown Resorts
- Vocus NZ’s $1.7bn acquisition of 2degrees, to form NZ’s 3rd largest mobile operator
- Brookfield’s $1.1bn offer to buy LaTrobe Financial Services from Blackstone
- EQT’s $710m bid for Stockland’s Retirement Living portfolio
- Quadrant PE’s sale of Experiences Australia Group to US strategic bidder Hornblower Cruises & Events for ~$450m
Unlike March 2020 where primary activity paused with only a small amount of secondary trading taking place, private pricing continues to widen with a number of deals stuck with investment banks who underwrote deals at 2021 prices. Despite the volatility activity levels remain elevated albeit with strong price and structure discipline that was the case last year.
Financial Credit:
Summary views: financials look neutral versus corporates. Offshore has repriced more than domestic financials. Avoid short-dated bank hybrids which are at risk of not being called.
When reviewing performance of financials, we often feel the need to add a disclaimer. The Australian financial system is effectively an oligopoly with our banks benefitting from significant government support. The direct implication is that they tend not to trade on fundamentals but rather on technical factors and changes in liquidity.
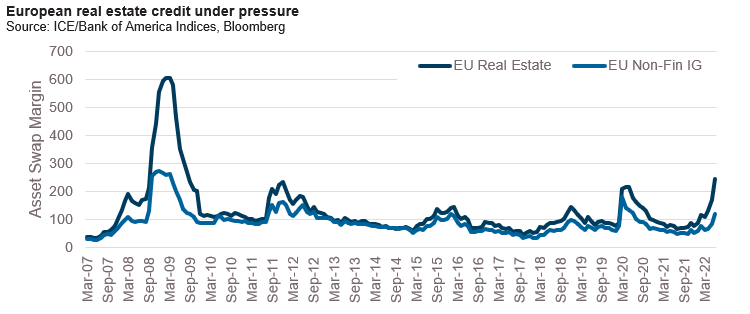
With this in mind charts such as the below one which shows that financial credit spreads have not widened in Australia as much as Europe or the United States are not surprising.
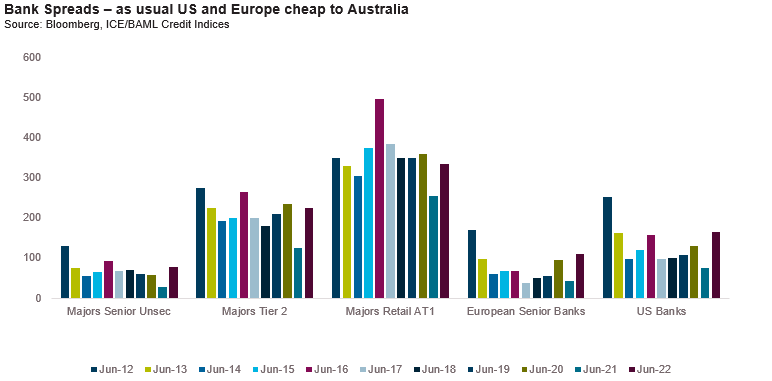
In our view the greater driver spread performance right now is lack of supply rather than weakening fundamentals. Through to the end of 2021, enormous inflows of deposits into the banking system to go with extraordinary monetary support meant the banks have had limited need to issue. With expected repayment dates coming on the Term Funding Facility and the very real risk that deposit flows moderate or even reverse, the major banks have become significant issuers.
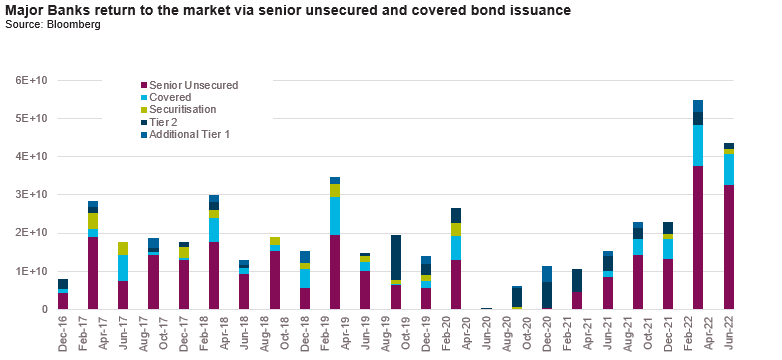
Two themes were interesting when looking at major bank issuance over the quarter. One was the re-emergence of covered bonds which are typically used as an alternative to senior when pricing is wide. Two is the sheer volume of senior unsecured issuance. In the first half of 2022 major banks issued over $70 billion in senior paper. The previous 6 month peak was $30 billion in aggregate issuance. Issuing in such volumes necessitates the banks to focus on where they can issue in volume, not necessarily where they can execute at the tightest spread. Currently this spread is around 30 basis points not including any new issue premium which are typically larger in US deals.
Away from senior markets we think the question of call risk within the subordinated debt complex is becoming very relevant. Within the listed AT1 market there are two maturities upcoming in 2H22 where the call option looks out of the money from a purely economic perspective. Both are pricing to call despite having interest margins which are 30-60 basis points out of the money compared where recent issues are trading (and arguably a lot more when you add a new issue premium). Recall that if a hybrid is not called the margin remains unchanged for two years before an optional exchange into equity two years later at a 1% premium to the face value of the notes. So the 1% premium can be compared to the increased cost of debt for a new issue. Of course, this analysis significantly simplifies the whole equation. Ongoing access to the retail hybrid market is important for the banks and if they don’t call future issuance could be more expensive. On the flipside, equity capital is worth a lot more than Additional Tier 1 capital. Last but not least is the role of the regulator who needs to approve the call. Taking all of these factors into account we suspect new issue spreads for AT1 would need to be well into the 400s for the call decision to be called into question (currently trading at 335 basis points though we think they should definitely be wider if you look at wider market moves).
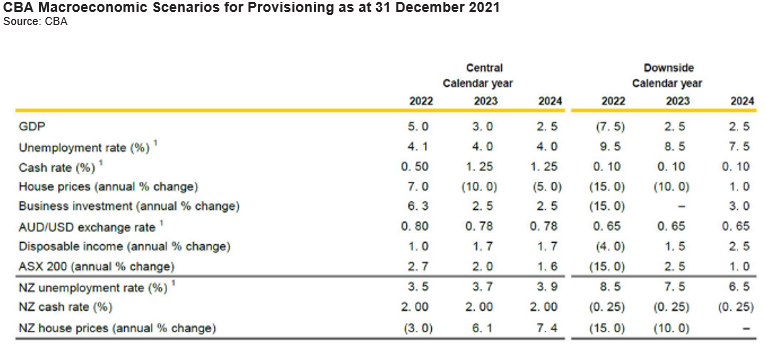
Relevant to the above point, fundamentals in the banking system are sound but not spectacular. Morgan Stanley analysts noted that the average capital ratio for the 4 majors went from 10.9% pre-COVID to 11.1% after accounting for asset sales, buybacks and dividends over that time. With the new capital framework set to be phased in from January 2023 and all signs pointing to significantly tighter financial conditions in the months to come, the capital position of the banking system could come into focus. To this end, the scenario’s banks are using to determine provisioning look certain to become meaningfully more conservative. Below we show CBA’s central and downside economic assumptions which flow into their expected loss provisioning.
ABS & Whole Loans:
Summary views: public markets have repriced and are starting to look more attractive relative to financials, both in domestic and offshore markets, private market needs to widen in response to public. Caution still warranted as the arbitrage between mortgage rates and funding costs is very tight.
For over a year we have been negative on domestic securitisation markets. We’ve held a strong view that pricing was too tight, driven in by demand by investors thirsty for yield who lacked appreciation for the illiquidity and structural risks of the asset class. Had we written this piece in late June rather than early July, this view would likely have been unchanged. However in July, we saw a step wider in pricing.
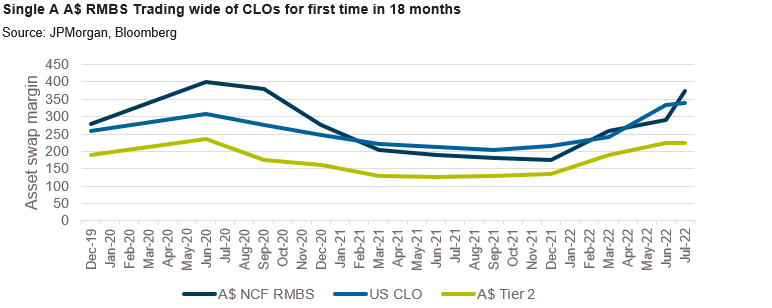
The step-widening in pricing was most pronounced in the investment grade part of the capital structure. Single A’s moved 85 basis points wider from the previous primary transaction and as shown below, are now pricing wider than similarly rated CLOs for the first time in 18 months.
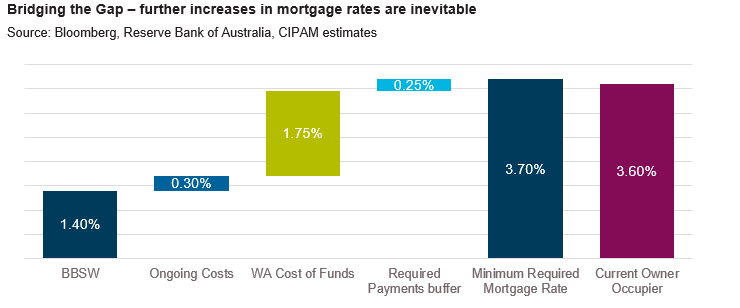
Despite this positive development with respect to pricing we remain cautious on the sector, particularly on prime residential mortgage-backed securities where we struggle to see the arbitrage working at current levels of pricing. As shown below, based on where we see current pricing, a prime mortgage portfolio needs to have a minimum blended mortgage rate of 3.7% versus a current new owner-occupied standard variable rated of 3.6% with investors expecting to see mortgage rates into the 4% plus area in order to generate a sufficient level of excess income.
Non-banks can temporarily hold back from this need to increase rates by more than the Reserve Bank by blending pools with more seasoned loans which typically carry higher rates or by adding in more non-standard loan types (investor loans, non-conforming loans, interest only loans) but eventually will have to increase mortgage rates by more than the RBA. In our view this is inevitable.
Whilst most pronounced in prime RMBS deals, the issue of excess spread erosion is prevalent across the entire market. With fixed rates having already increased, excess spread on auto and equipment loan securitisations is being squeezed. Similarly in non-conforming markets where mortgage rates are higher, but so are loss expectations.
A risk for markets is that a vicious cycle emerges where higher interest rates lead result in tighter financial conditions which lead to wider credit spreads/higher funding costs forcing more increases in interest rates. The counterbalancing factor is that more lending will flow to the banking system away from non-banks resulting in slower levels of securitisation issuance.
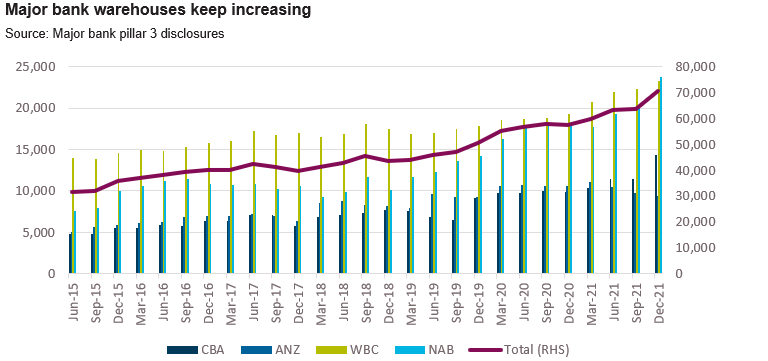
Slower issuance will support credit spreads but we’d caution that this will take some time to play out. As the below chart shows, major bank warehouses continue to increase, standing at $75 billion as at the end of March.
In offshore markets spread moves have tracked more in line with wider markets. These moves have encouraged US and European domiciled investors to favour their home markets over Australia and New Zealand. We have previously noted the moves in Credit Risk Transfer (CRT) securitisations where single A rated tranches have moved 200 basis points wider calendar year to date, compared to a 75 basis point move in corporate credit. Similarly, single A-rated tranches in UK RMBS markets are pricing in the mid-300s currently, also around 200 basis points wider year to date.
Real Estate Loans:
Summary views: strong relative value in REITs paper despite governance and valuation risks, domestic private markets activity is picking up
We start this quarter by highlighting the exceptional relative value we are seeing in European markets. European bonds issued by the real estate sector have widened 175 basis points since the tights of the market compared to 75 basis points for non-financial issuers despite being slightly shorter (5.3 versus 5.7 year spread duration) and having the same average credit rating (BBB+).
A mid 250 basis point asset swapped margin in Euros translates to around 330 basis points swapped into Australian dollars. The move wider was started by governance questions facing accounting methods used by Scandinavian property groups but has dragged the whole sector wider leading to selective opportunities in borrowers with established investment assets with observable and transparent valuations.
We call out Europe not just because of the compelling valuations in the sector but also to highlight the need for investors to focus on the governance. It is not enough to look through to a credit rating or a loan to value ratio. Valuations and importantly, the process used to arrive at a valuation need to be assessed particularly when it comes to property developments and other non-stabilised assets.
Indeed Europe is really the next shoe to drop after China where the BofA China Senior Real Estate index has widened 2,000 basis points over the previous 12 months.
Domestically the real estate sector has not been caught up in the contagion. End of financial year asset valuations were flat as risk adjusted cap rates tightened due to the significant increase in bond yields. Listed REITs are reflecting the valuation risks in the sector and trading around 20% lower than the peak prices a year ago. However, despite the valuation risks in the sector, the starting gearing levels in the mid-20s for the sector allow for meaningful declines in valuations.
On the private lending side APRA data through the March 2022 quarter showed commercial property exposure limits for ADI’s continued to increase ending at $402.5 billion ($348.9 billion drawn) with growth across all sectors. Interestingly banks seem to have re-discovered their appetite for land development and residential lending, both sectors which were out of favour up until the six months through end March 2022.
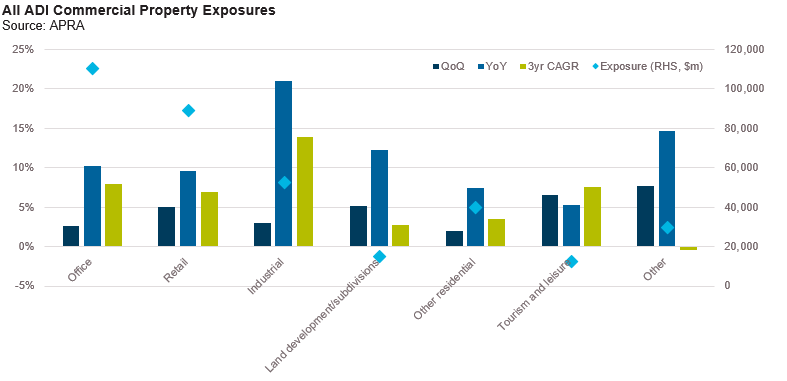
Lending growth continues to be fuelled by foreign branch banks who increased their exposures by over 22% in the prior 12 months including over 50% growth in industrial exposure. We have previously noted the pressures facing the Chinese banking sector and have been surprised that foreign branch banks have been so willing to extend credit. With the pressure intensifying in recent weeks, we may have just been early in our call.
Despite strong lending volumes by the banks we are seeing healthy levels of activity in private markets and evidence of re-pricing reflecting the wider pricing seen in public markets. Activity is varied across retail, transitional office and super senior residual stock lending. Industrial assets are still well sponsored by banks in line with the chart shown above.
On behalf of the team thanks for reading.
Pete Robinson Head of Investment Strategy – Fixed Income
1 Consider the combination of the Russian invasion of Ukraine, the decline in the Euro, the fact it is a net importer of energy, the high leverage in sovereign borrowers (eg. Italy) and its close trade ties to China as all contributing to economic pressures.
Unless otherwise specified, any information contained in this material is current as at date of publication and is provided by Challenger Investment Partners Limited (CIP Asset Management, CIPAM) (ABN 29 092 382 842, AFSL 234678), the investment manager of the CIPAM Credit Income Fund and CIPAM Multi-Sector Private Lending Fund (the Funds). Fidante Partners Limited ABN 94 002 835 592, AFSL 234668 (Fidante) is the responsible entity and issuer of interests in the Funds. Fidante and CIPAM are members of the Challenger Limited group of companies (Challenger Group). Information is intended to be general only and not financial product advice and has been prepared without taking into account your objectives, financial situation or needs. You should consider whether the information is suitable to your circumstances. The Fund’s Target Market Determination and Product Disclosure Statement (PDS) available at www.fidante.com.au should be considered before making a decision about whether to buy or hold units in the Fund. Past performance is not a reliable indicator of future performance.
Fidante and CIPAM are not authorised deposit-taking institutions (ADI) for the purpose of the Banking Act 1959 (Cth), and their obligations do not represent deposits or liabilities of an ADI in the Challenger Group (Challenger ADI) and no Challenger ADI provides a guarantee or otherwise provides assurance in respect of the obligations of Fidante and CIPAM. Investments in the Fund are subject to investment risk, including possible delays in repayment and loss of income or principal invested. Accordingly, the performance, the repayment of capital or any particular rate of return on your investments are not guaranteed by any member of the Challenger Group. Any projections are based on assumptions which we believe are reasonable, but are subject to change and should not be relied upon.